wert = np.array([1., 2., 4., 8.])

radius_falsch = wert / wert[0]
radius_richtig = np.sqrt(wert / wert[0])

print(pd.DataFrame({"wert": wert,
                    "radius_falsch": radius_falsch,
                    "flaeche_falsch": radius_falsch ** 2,
                    "radius_richtig": radius_richtig,
                    "flaeche_richtig": radius_richtig ** 2}).round(3).T)

print({"echter_unterschied": 8,
       "flaeche_korrekt_kodiert": 8,
       "davon_wahrgenommen": round(8 ** 0.7, 2),
       "flaeche_bei_radiuskodierung": 64,
       "davon_wahrgenommen_2": round(64 ** 0.7, 2)})

fig, achsen = plt.subplots(1, 2, figsize=(7, 3.2))
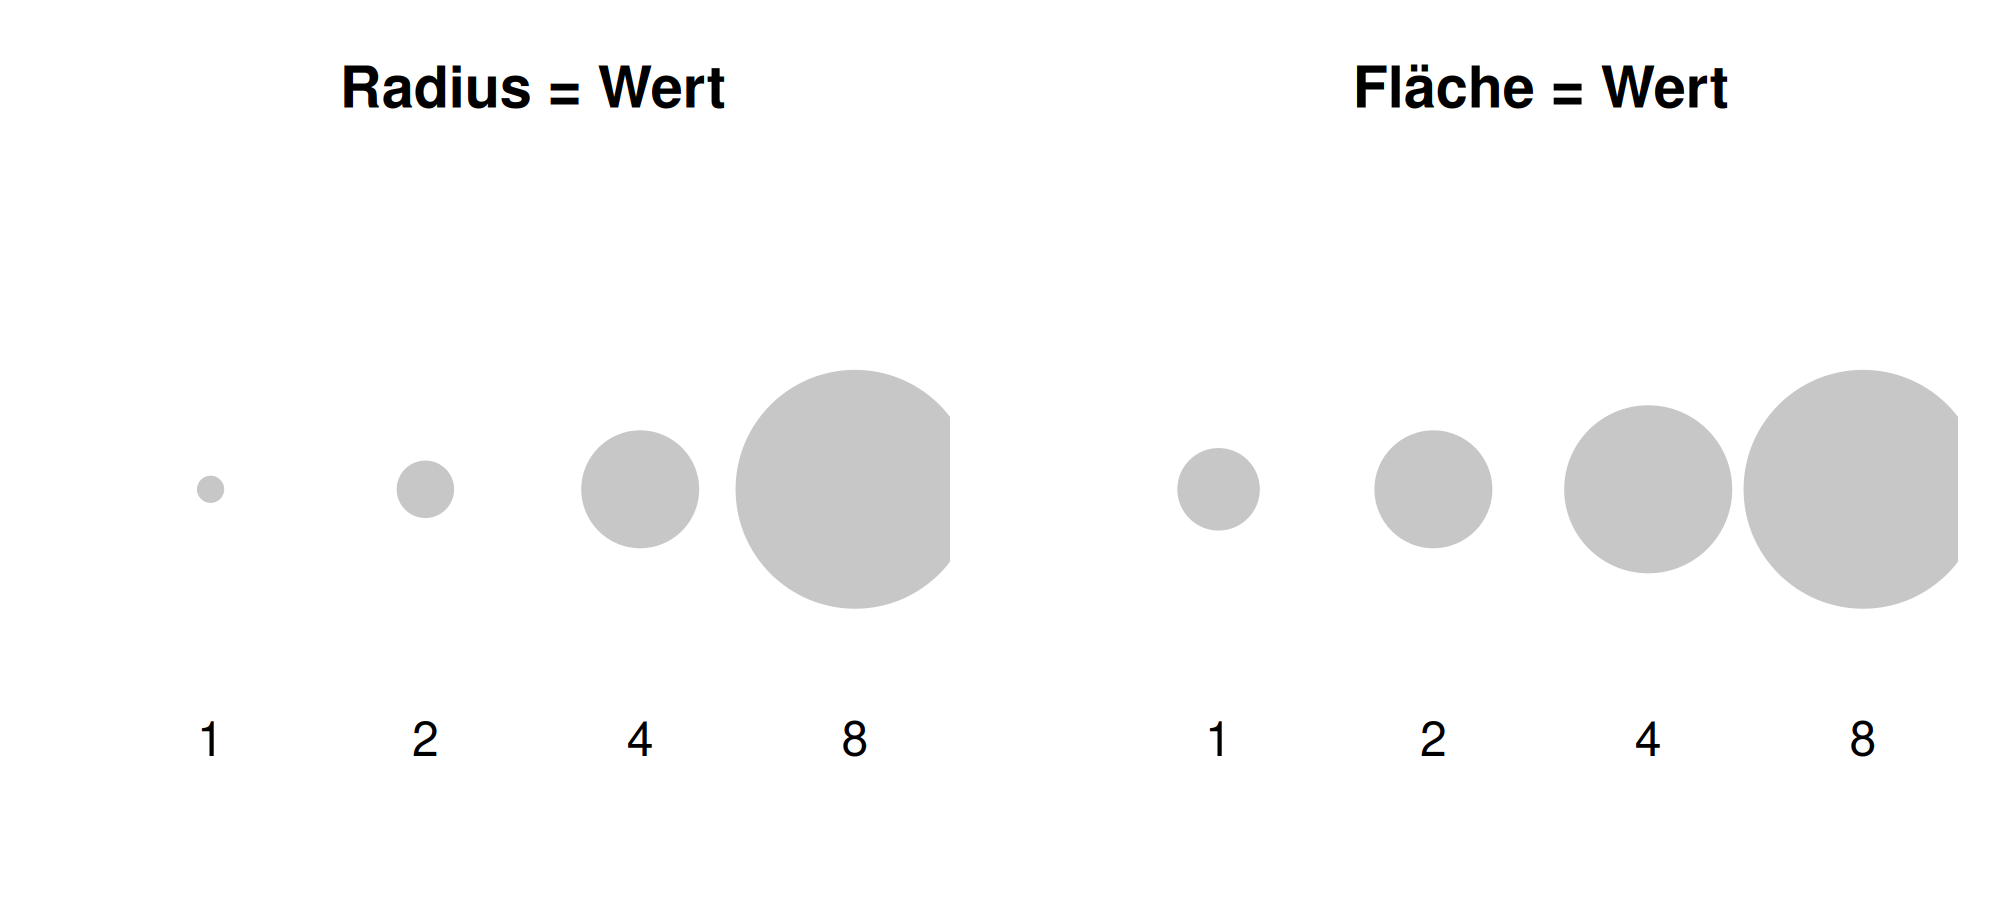
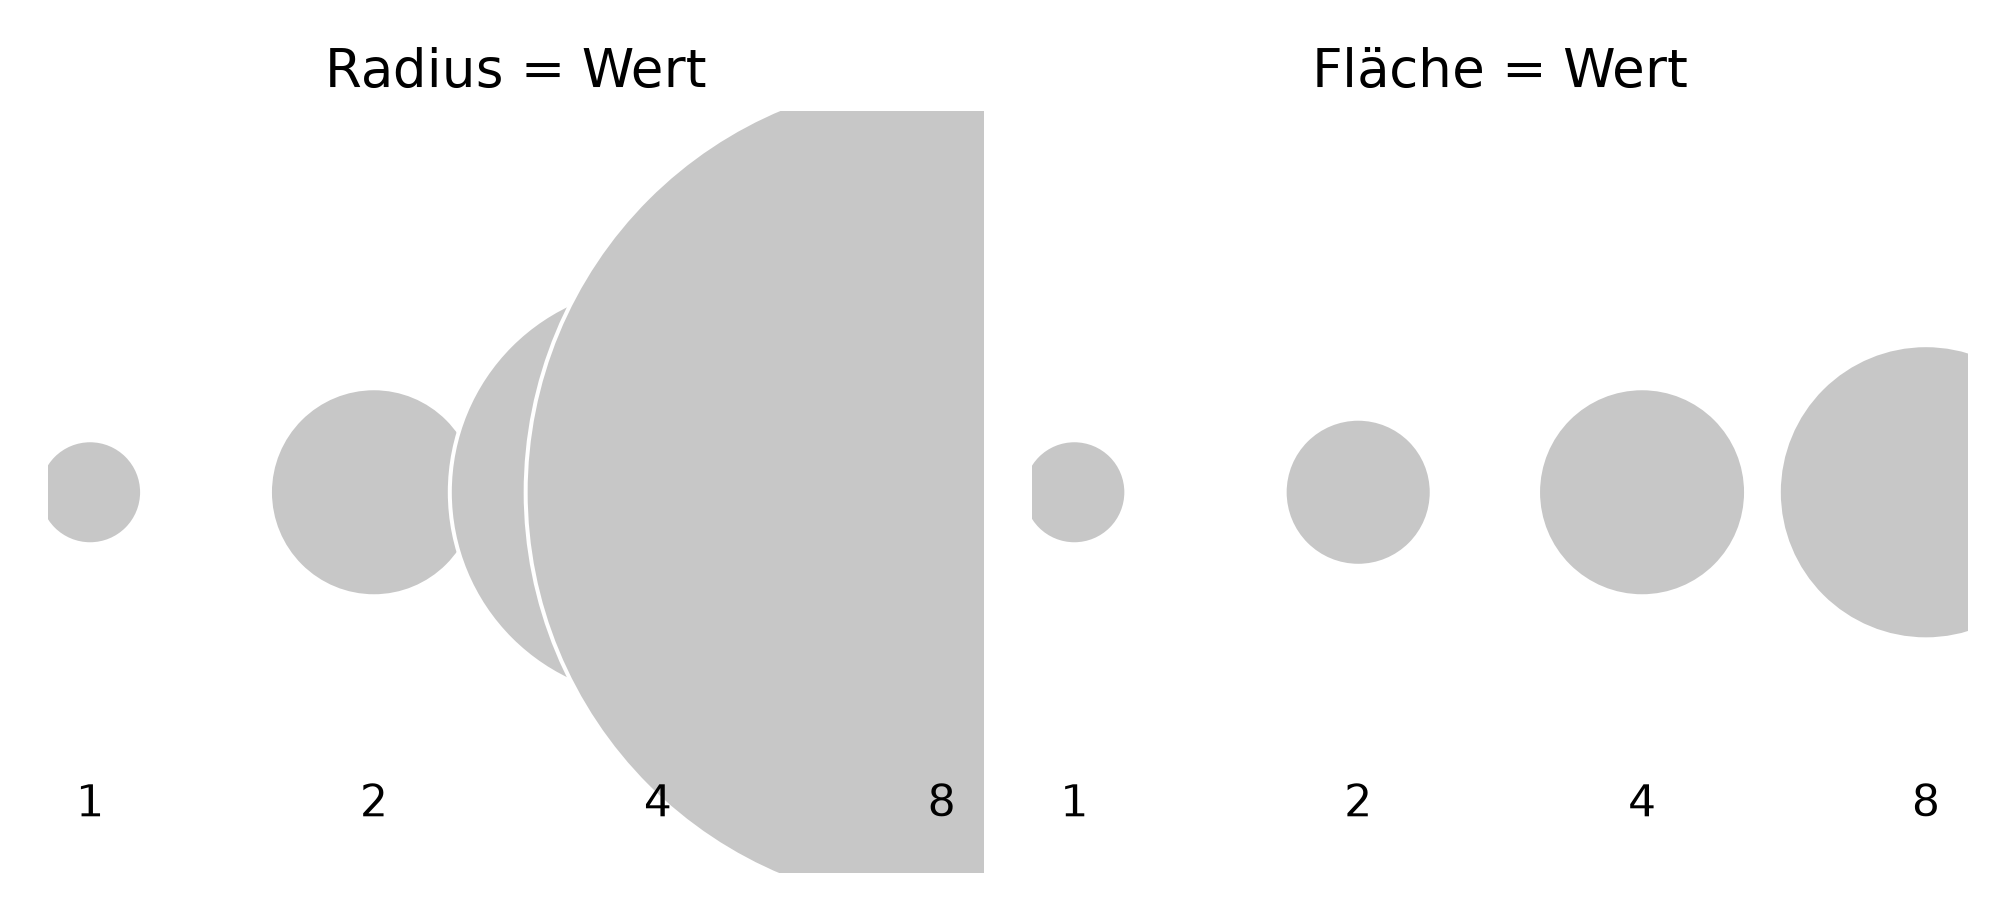
for achse, (titel, r) in zip(achsen, [("Radius = Wert", radius_falsch),
                                      ("Fläche = Wert", radius_richtig)]):
    # In matplotlib ist s die FLAECHE des Punktes, nicht der Radius.
    _ = achse.scatter(np.arange(1, 5), np.zeros(4), s=(r * 26) ** 2,
                      color=NEUTRAL, edgecolor="white")
    for x, w in zip(np.arange(1, 5), wert):
        _ = achse.text(x, -0.85, str(int(w)), ha="center")
    _ = achse.set_title(titel)
    _ = achse.set_ylim(-1, 1)
    _ = achse.axis("off")
plt.tight_layout()
plt.show()