x123 = np.array([10, 8, 13, 9, 11, 14, 6, 4, 12, 7, 5], dtype=float)
saetze = {
    1: (x123, np.array([8.04, 6.95, 7.58, 8.81, 8.33, 9.96, 7.24, 4.26,
                        10.84, 4.82, 5.68])),
    2: (x123, np.array([9.14, 8.14, 8.74, 8.77, 9.26, 8.10, 6.13, 3.10,
                        9.13, 7.26, 4.74])),
    3: (x123, np.array([7.46, 6.77, 12.74, 7.11, 7.81, 8.84, 6.08, 5.39,
                        8.15, 6.42, 5.73])),
    4: (np.array([8, 8, 8, 8, 8, 8, 8, 19, 8, 8, 8], dtype=float),
        np.array([6.58, 5.76, 7.71, 8.84, 8.47, 7.04, 5.25, 12.50, 5.56,
                  7.91, 6.89])),
}

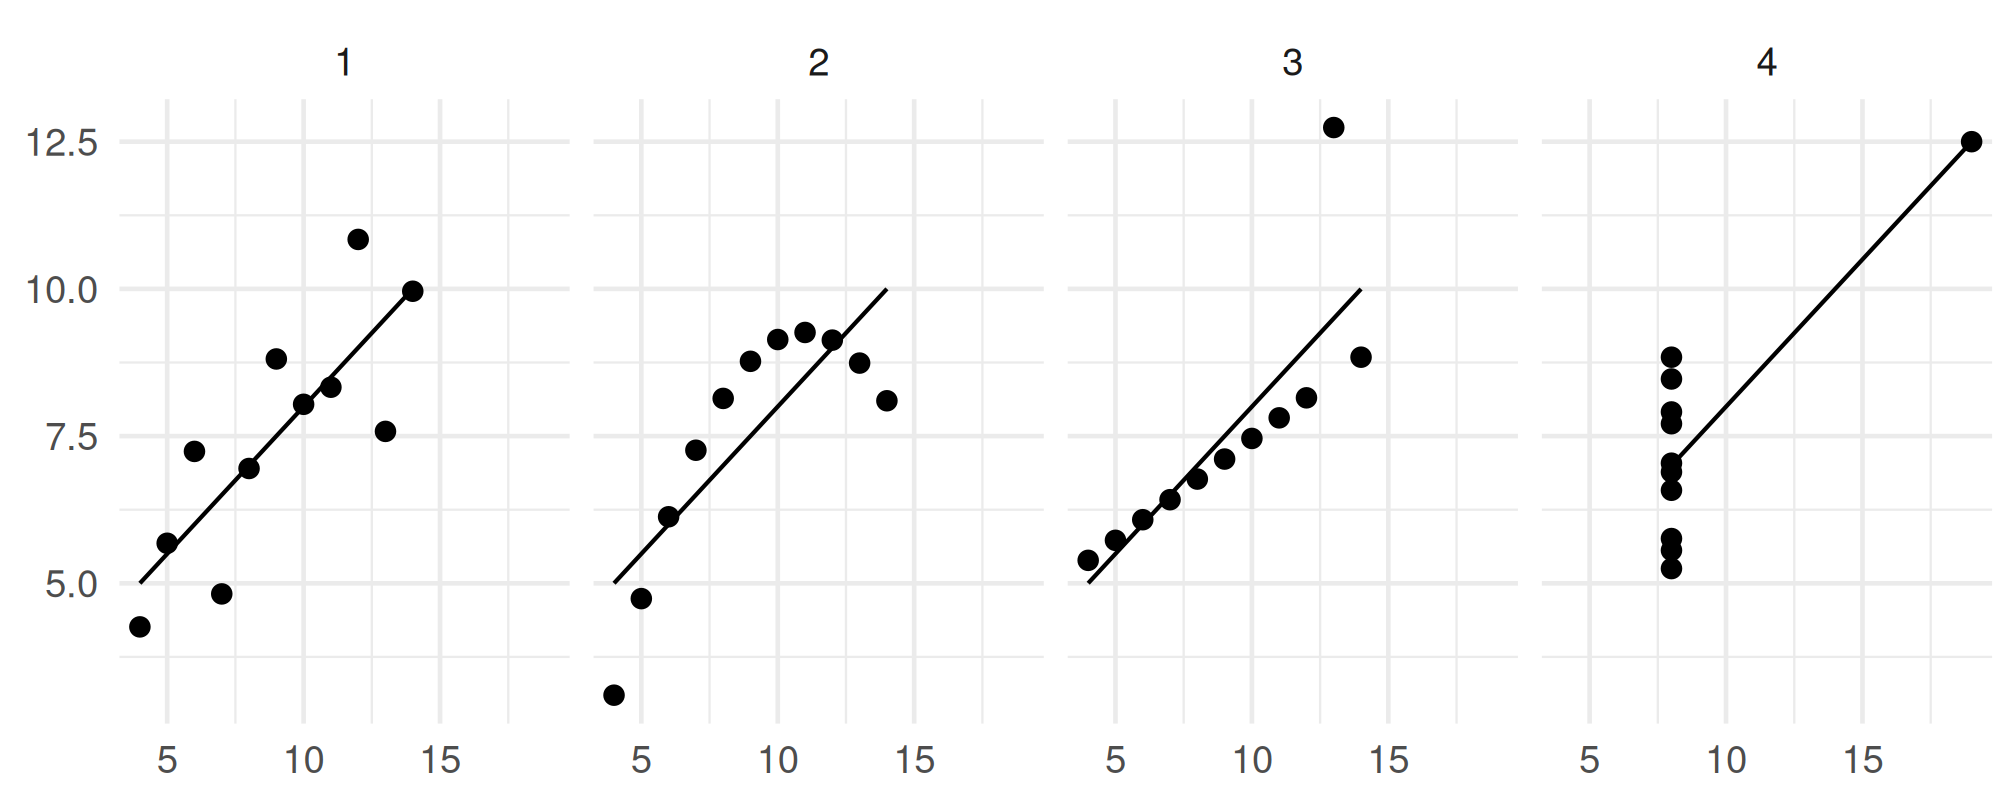
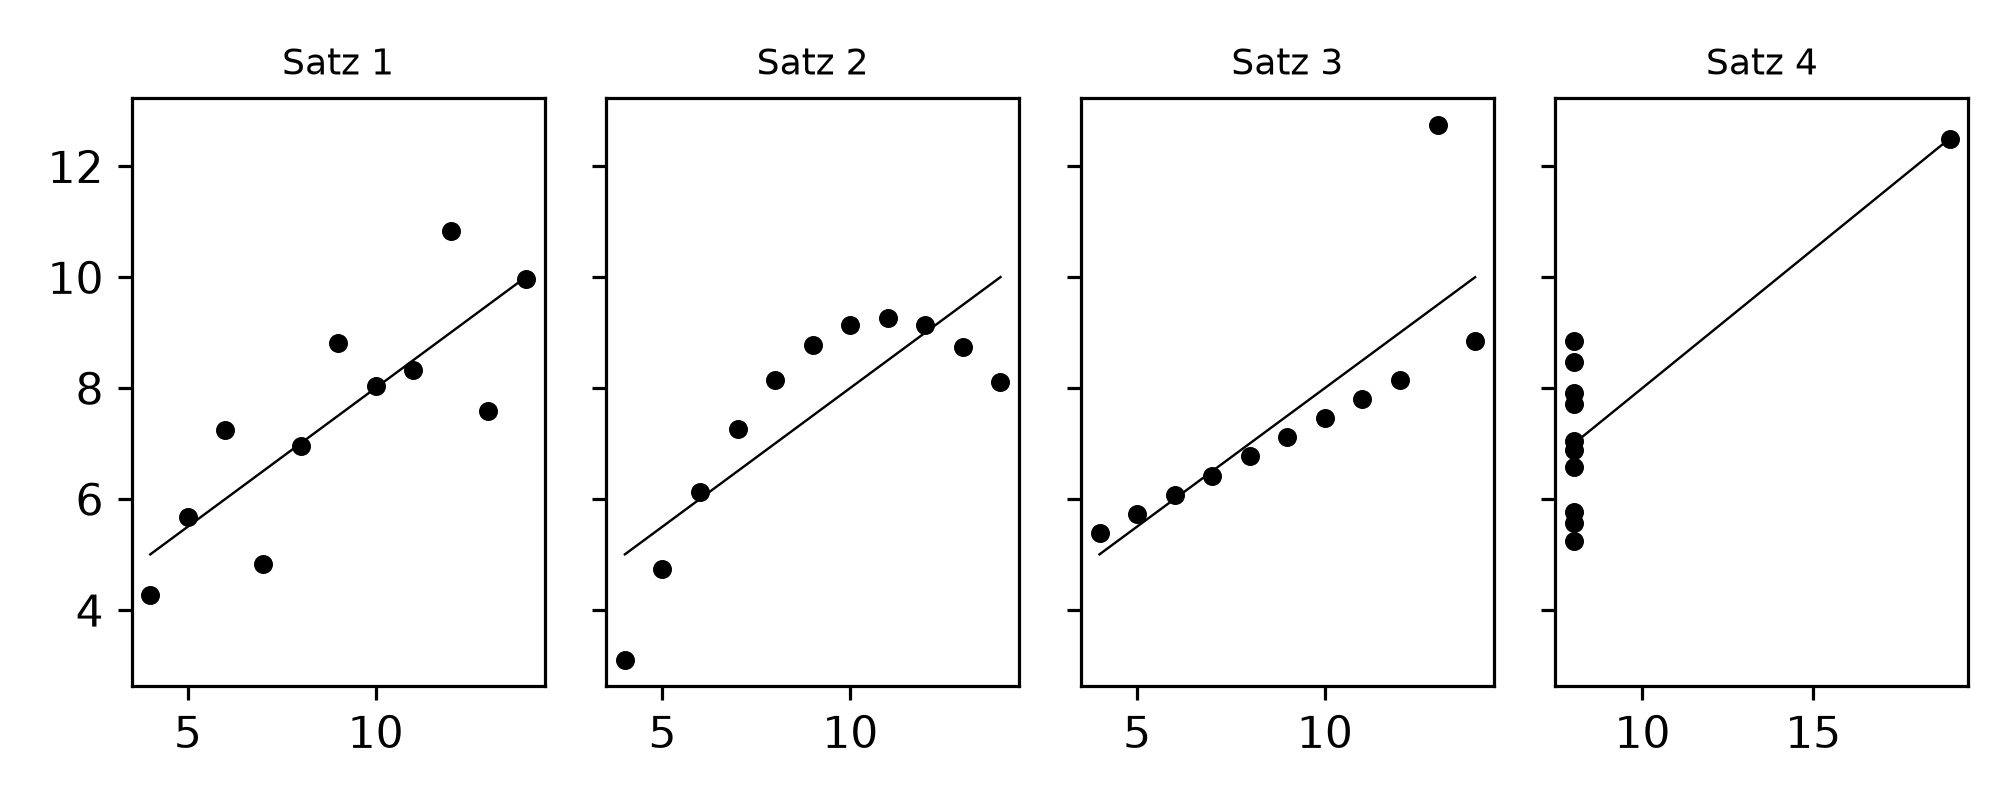
fig, achsen = plt.subplots(1, 4, figsize=(7, 2.8), sharey=True)
zeilen = []
for achse, (nummer, (x, y)) in zip(achsen, saetze.items()):
    achse.scatter(x, y, s=14, color="black")
    steigung, achsenabschnitt = np.polyfit(x, y, 1)
    gitter = np.linspace(x.min(), x.max(), 2)
    achse.plot(gitter, achsenabschnitt + steigung * gitter,
               color="black", lw=0.6)
    achse.set_title(f"Satz {nummer}", fontsize=9)
    zeilen.append({"satz": nummer, "mittel_x": x.mean(), "sd_x": x.std(ddof=1),
                   "mittel_y": y.mean(), "sd_y": y.std(ddof=1),
                   "pearson": np.corrcoef(x, y)[0, 1],
                   "spearman": stats.spearmanr(x, y).statistic})
plt.tight_layout()
plt.show()