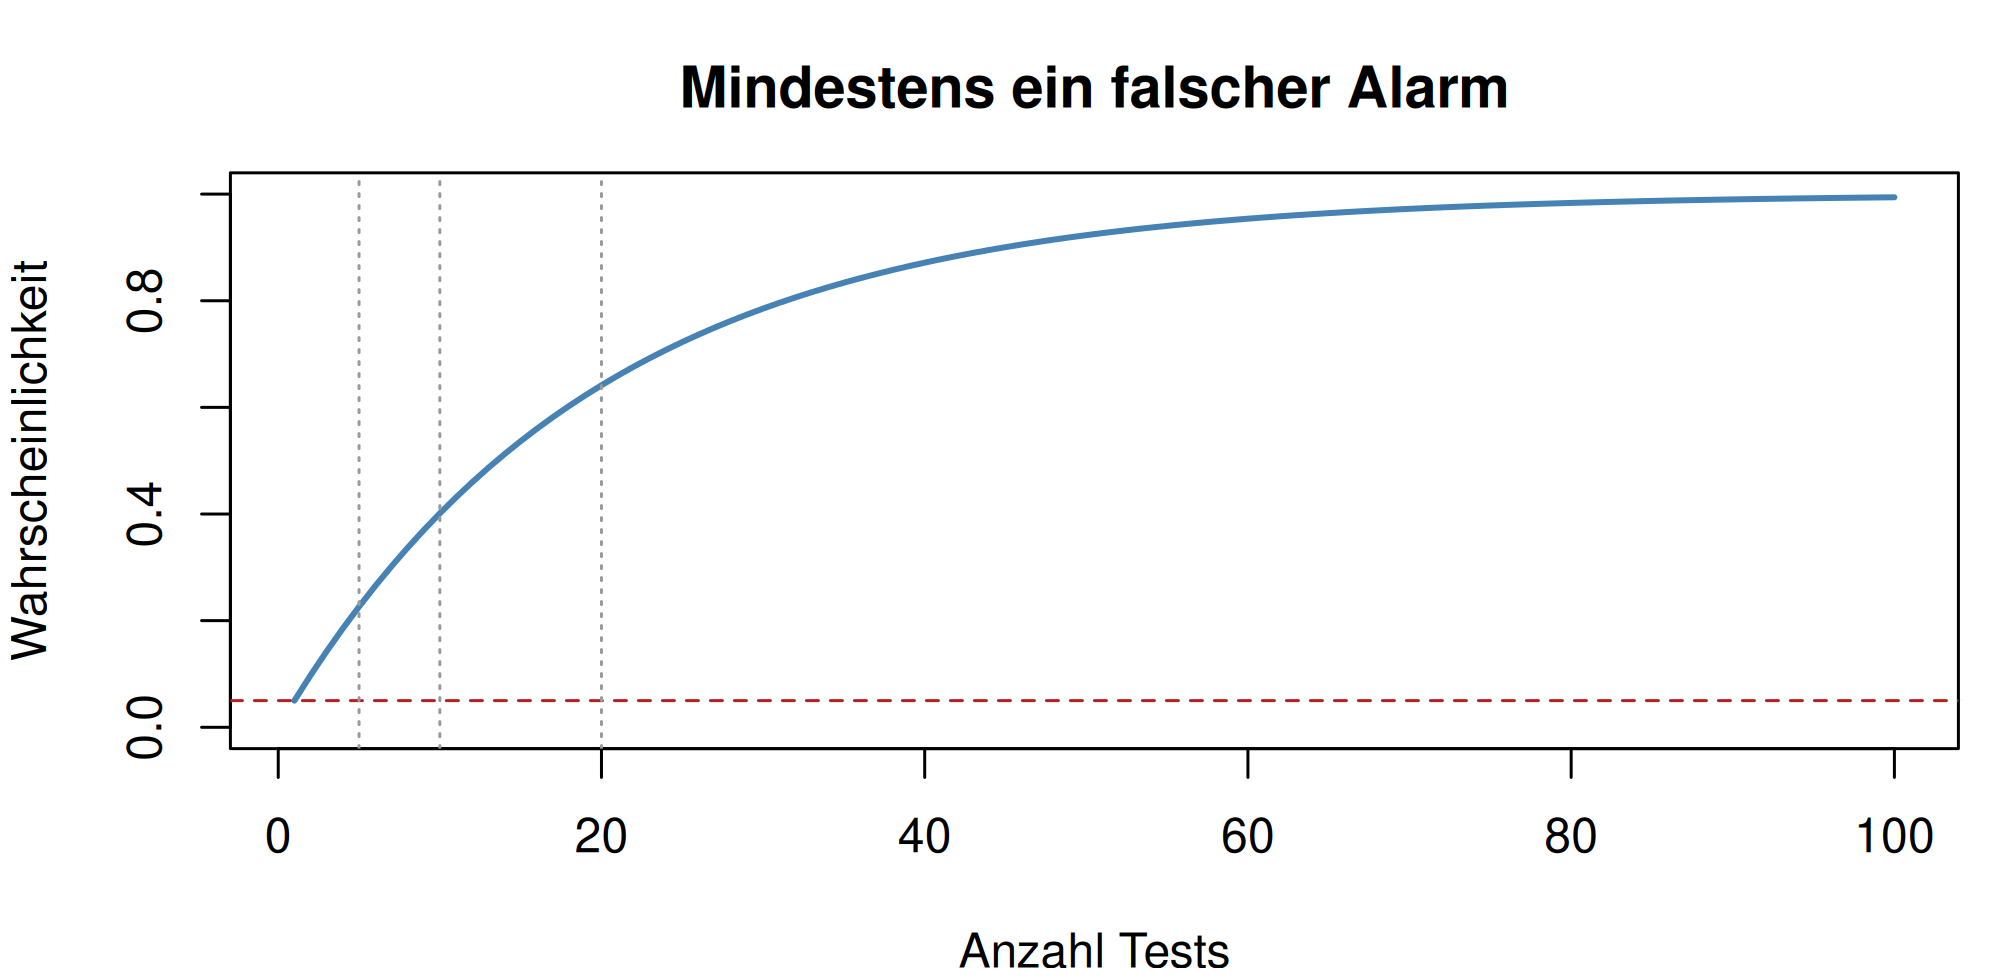
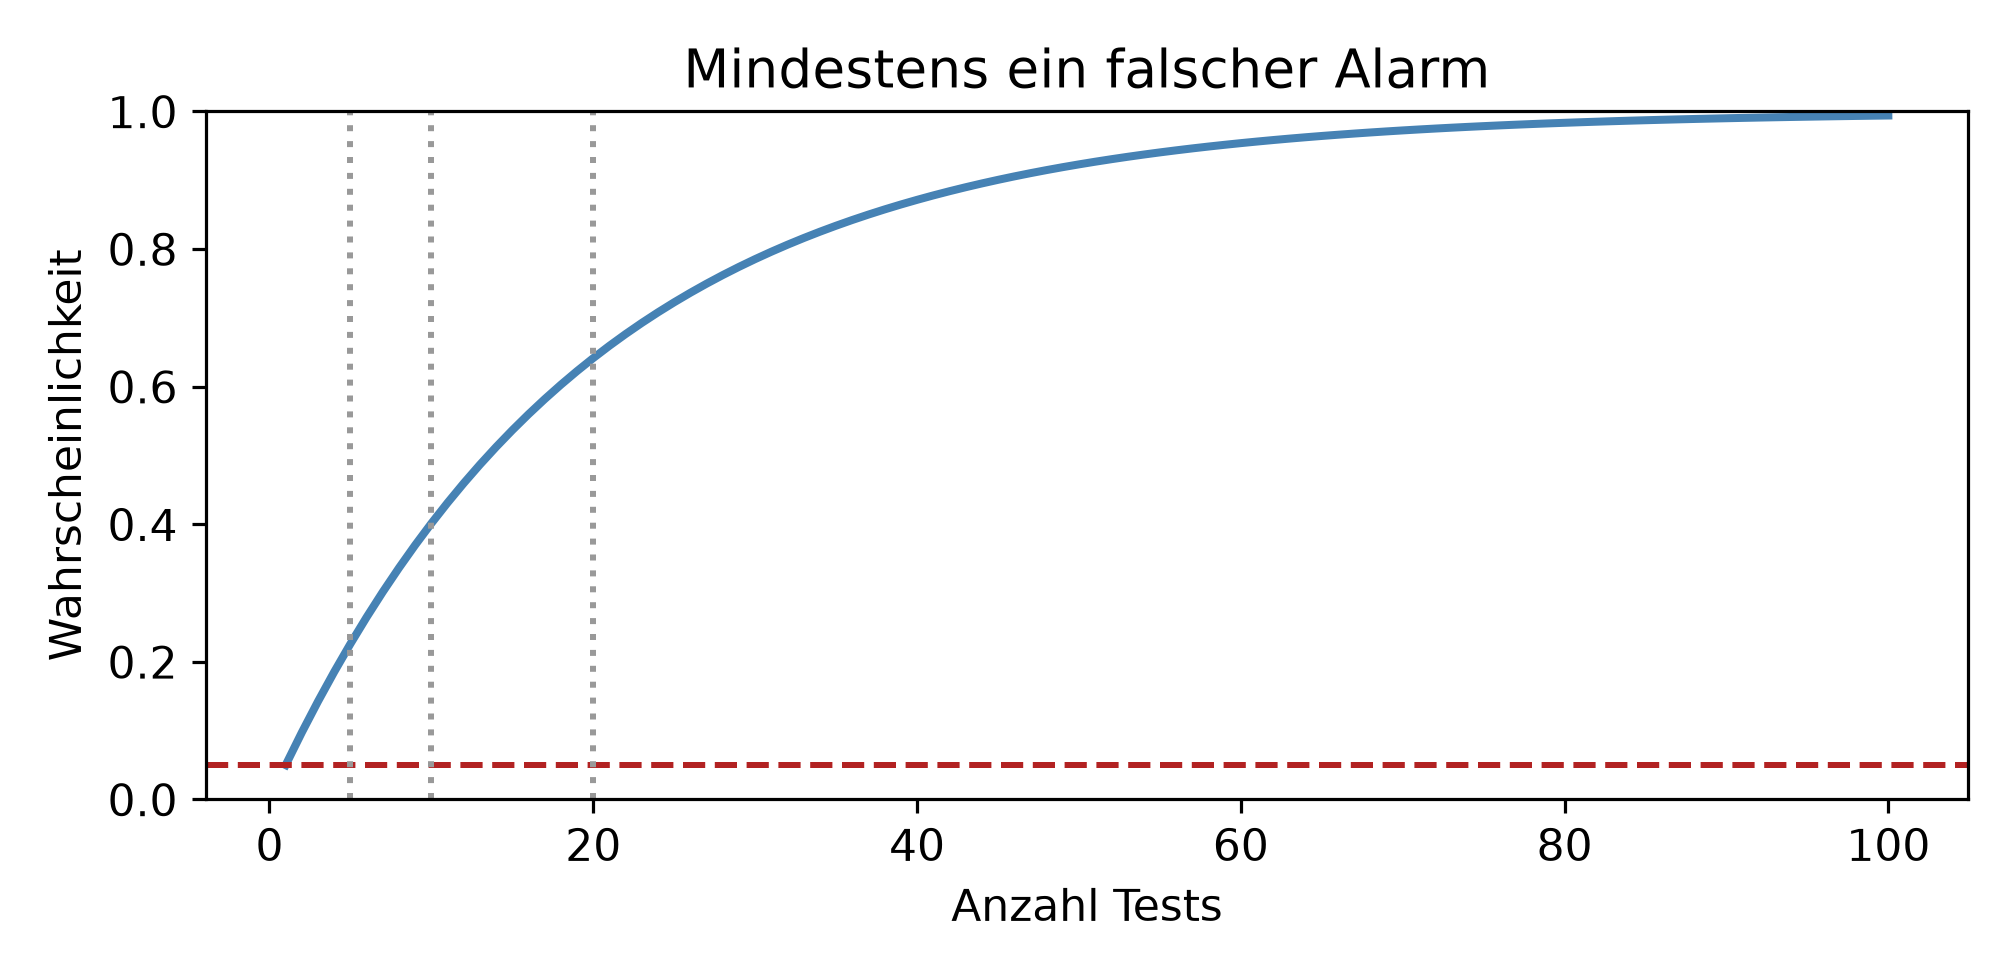
anzahl <- 1:100
rate <- 1 - (1 - 0.05)^anzahl

par(mar = c(4, 4, 3, 1))
plot(anzahl, rate, type = "l", lwd = 2, col = "steelblue", ylim = c(0, 1),
     xlab = "Anzahl Tests", ylab = "Wahrscheinlichkeit",
     main = "Mindestens ein falscher Alarm")
abline(h = 0.05, lty = 2, col = "firebrick")
abline(v = c(5, 10, 20), lty = 3, col = "grey60")

round(data.frame(tests = c(1, 3, 5, 10, 20, 50, 100),
                 rate = 1 - 0.95^c(1, 3, 5, 10, 20, 50, 100)), 4)
tests rate
1 1 0.0500
2 3 0.1426
3 5 0.2262
4 10 0.4013
5 20 0.6415
6 50 0.9231
7 100 0.9941