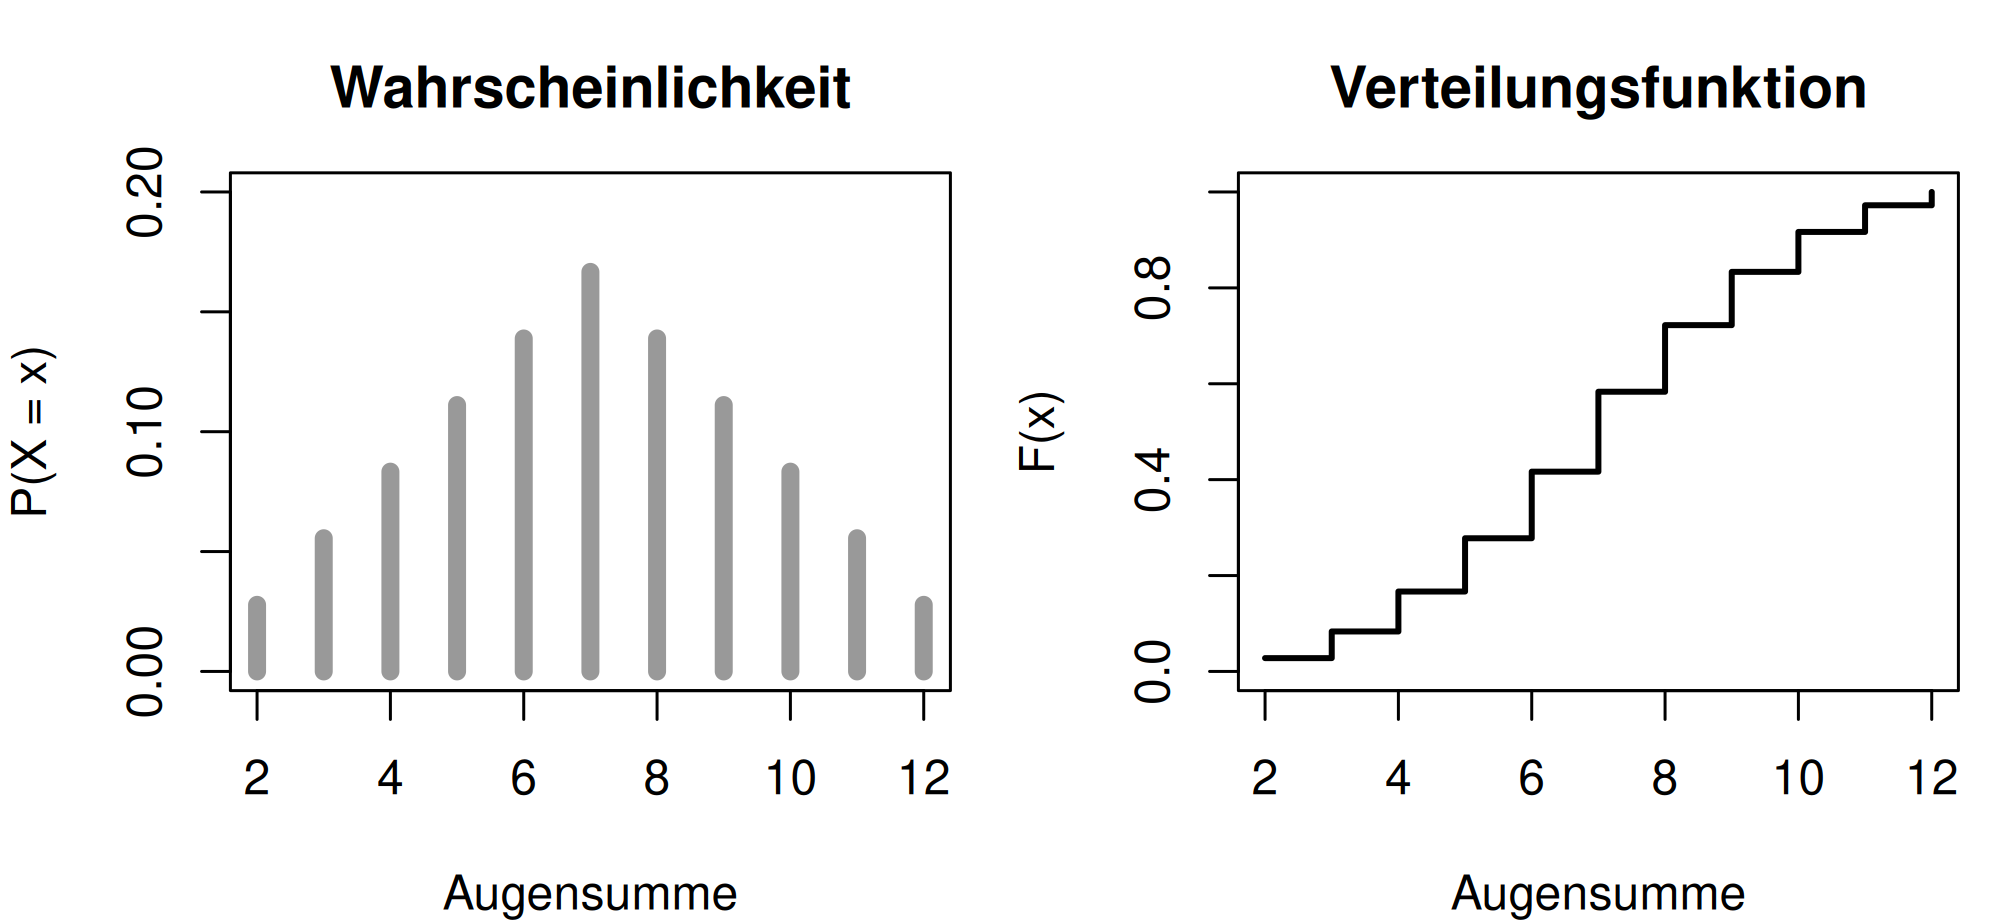
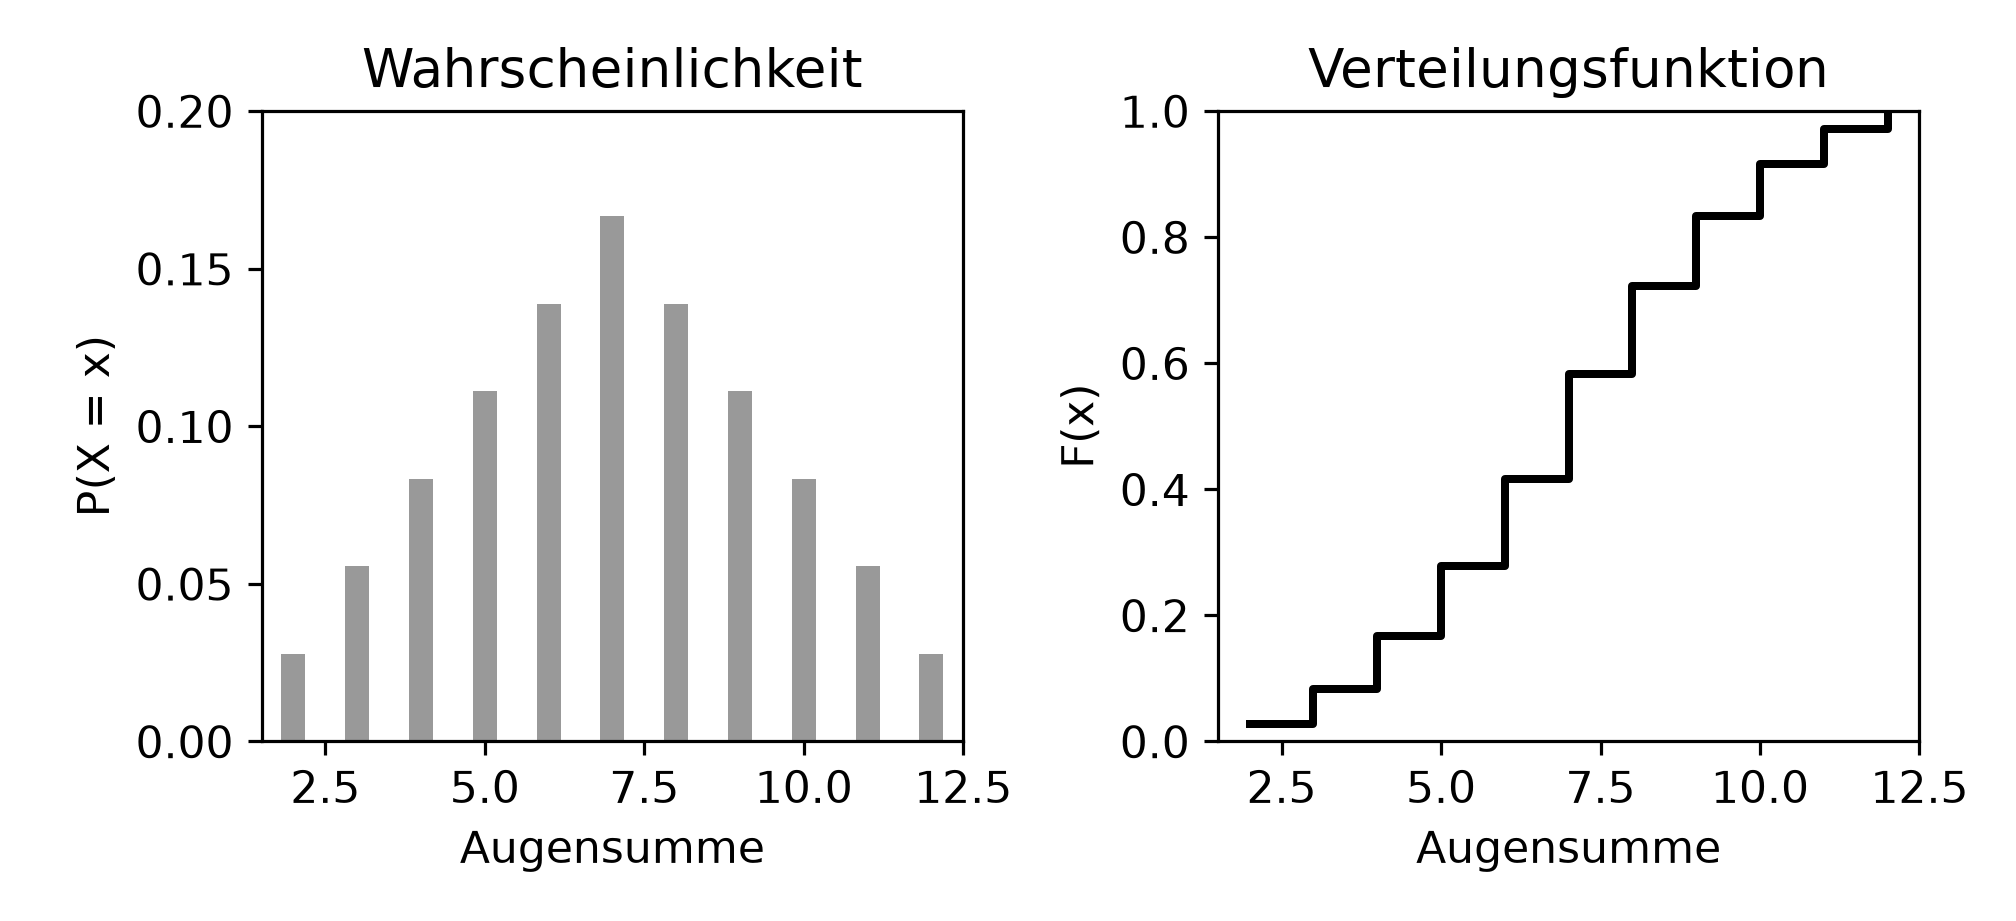
kombinationen <- expand.grid(wurf1 = 1:6, wurf2 = 1:6)
summe <- kombinationen$wurf1 + kombinationen$wurf2

table(summe)                        # wie viele Kombinationen je Summe
summe
2 3 4 5 6 7 8 9 10 11 12
1 2 3 4 5 6 5 4 3 2 1 round(prop.table(table(summe)), 4) # die Wahrscheinlichkeitsfunktionsumme
2 3 4 5 6 7 8 9 10 11 12
0.0278 0.0556 0.0833 0.1111 0.1389 0.1667 0.1389 0.1111 0.0833 0.0556 0.0278 round(cumsum(prop.table(table(summe))), 4) # die Verteilungsfunktion 2 3 4 5 6 7 8 9 10 11 12
0.0278 0.0833 0.1667 0.2778 0.4167 0.5833 0.7222 0.8333 0.9167 0.9722 1.0000 werte <- as.numeric(names(table(summe)))
p <- as.numeric(prop.table(table(summe)))
par(mfrow = c(1, 2), mar = c(4, 4, 3, 1))
plot(werte, p, type = "h", lwd = 6, col = "grey60", ylim = c(0, 0.2),
xlab = "Augensumme", ylab = "P(X = x)", main = "Wahrscheinlichkeit")
plot(werte, cumsum(p), type = "s", lwd = 2, ylim = c(0, 1),
xlab = "Augensumme", ylab = "F(x)", main = "Verteilungsfunktion")
par(mfrow = c(1, 1))