gruppe = np.repeat(["A", "B", "C"], 20)
x = np.concatenate([np.linspace(1, 4, 20), np.linspace(4, 7, 20),
                    np.linspace(7, 10, 20)])
y = np.concatenate([np.linspace(6, 4, 20), np.linspace(9, 7, 20),
                    np.linspace(12, 10, 20)])

print({"gesamtsteigung": round(steigung(x, y), 4),
       "gesamtkorrelation": round(float(np.corrcoef(x, y)[0, 1]), 4)})
for g in "ABC":
    m = gruppe == g
    print(f"Gruppe {g}: Steigung {steigung(x[m], y[m]):7.4f}"
          f"  Korrelation {np.corrcoef(x[m], y[m])[0, 1]:7.4f}")

farben = {"A": "#1b7837", "B": "#762a83", "C": "#b35806"}
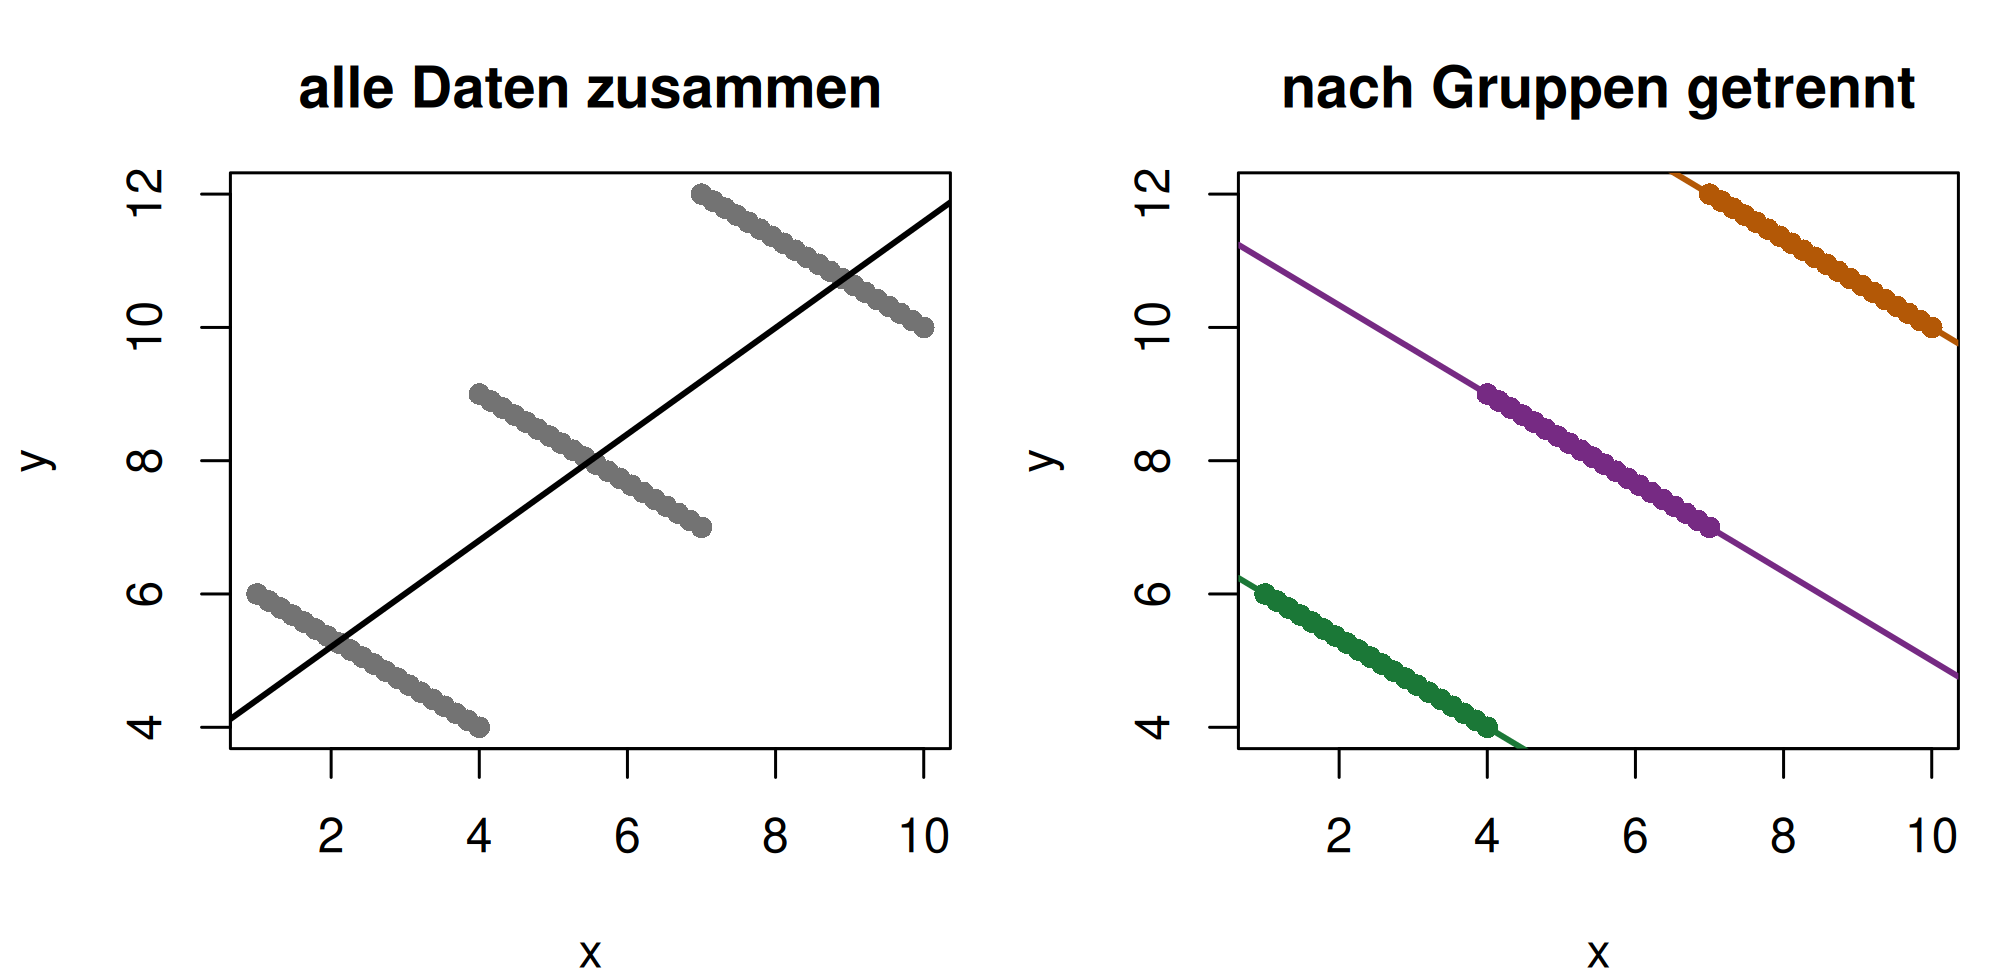
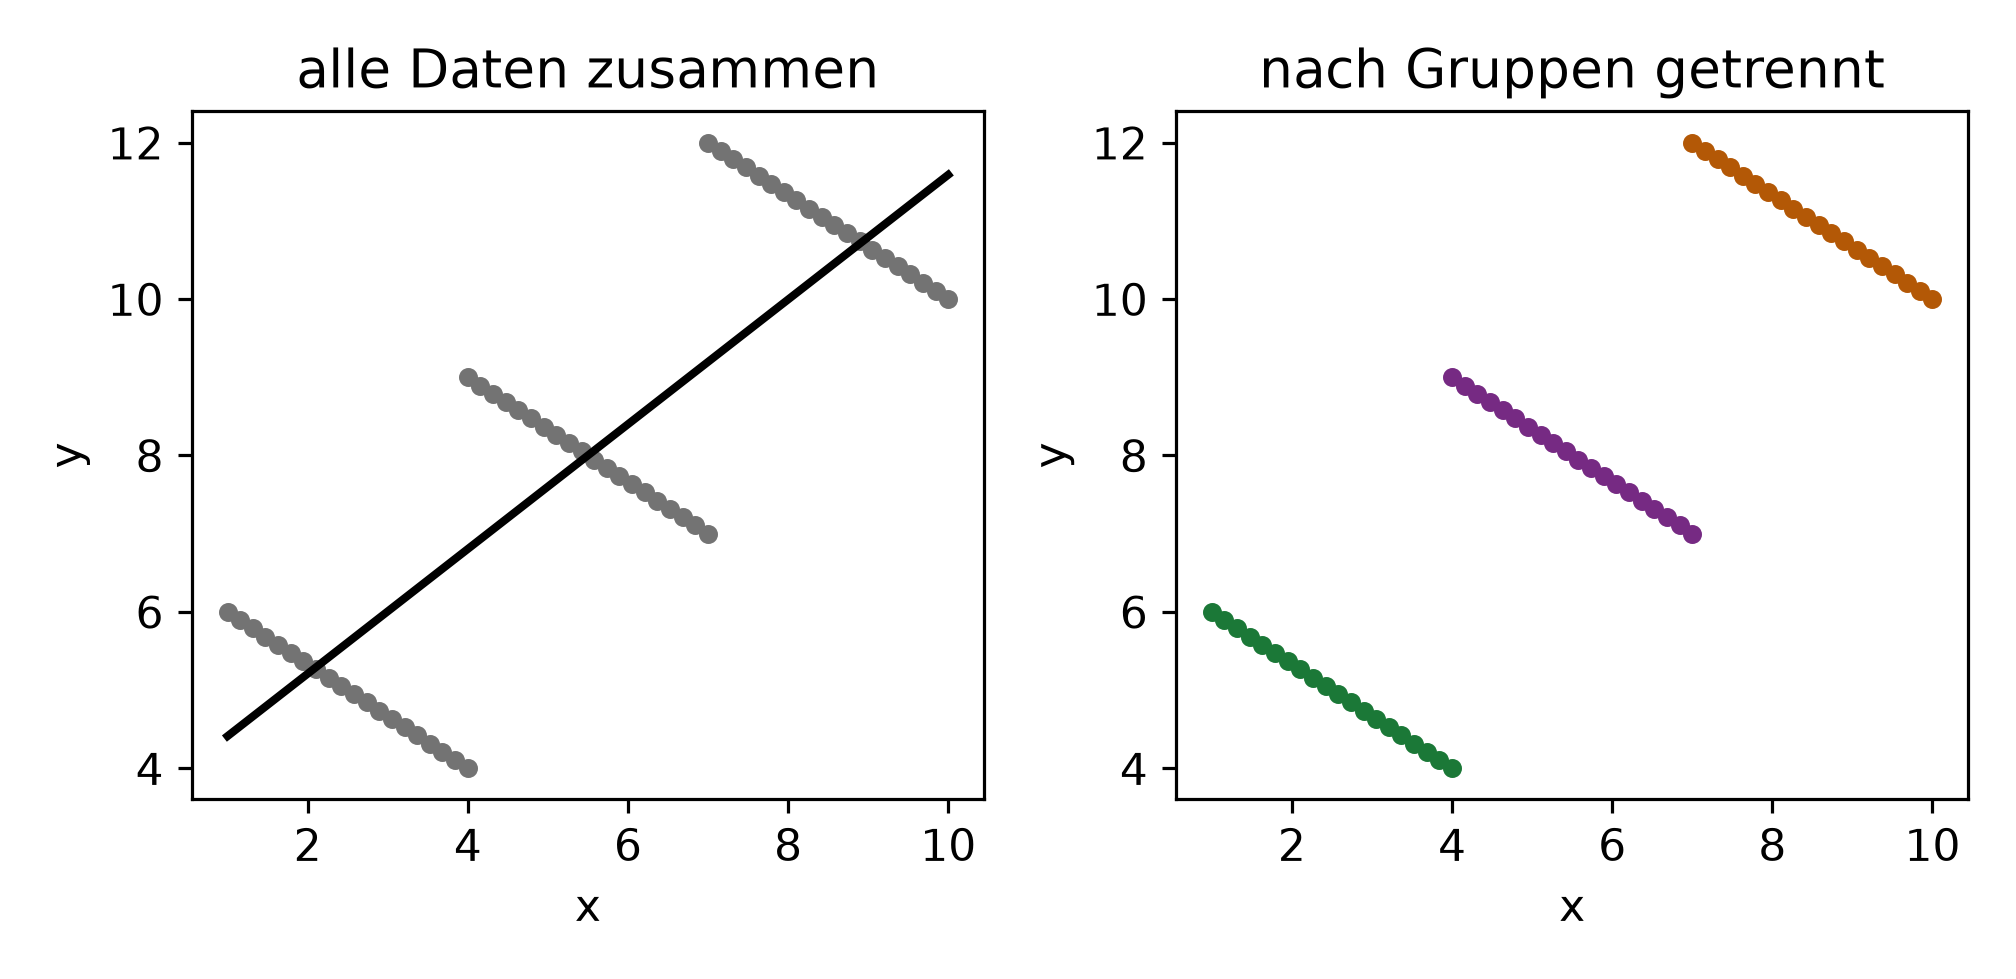
fig, achsen = plt.subplots(1, 2, figsize=(7, 3.4))
_ = achsen[0].scatter(x, y, s=14, color="0.45")
k, d = np.polyfit(x, y, 1)
_ = achsen[0].plot(x, k * x + d, lw=2, color="black")
_ = achsen[0].set_title("alle Daten zusammen")
for g in "ABC":
    m = gruppe == g
    _ = achsen[1].scatter(x[m], y[m], s=14, color=farben[g])
    kg, dg = np.polyfit(x[m], y[m], 1)
    _ = achsen[1].plot(x[m], kg * x[m] + dg, lw=2, color=farben[g])
_ = achsen[1].set_title("nach Gruppen getrennt")
for achse in achsen:
    _ = achse.set_xlabel("x")
    _ = achse.set_ylabel("y")
plt.tight_layout()
plt.show()