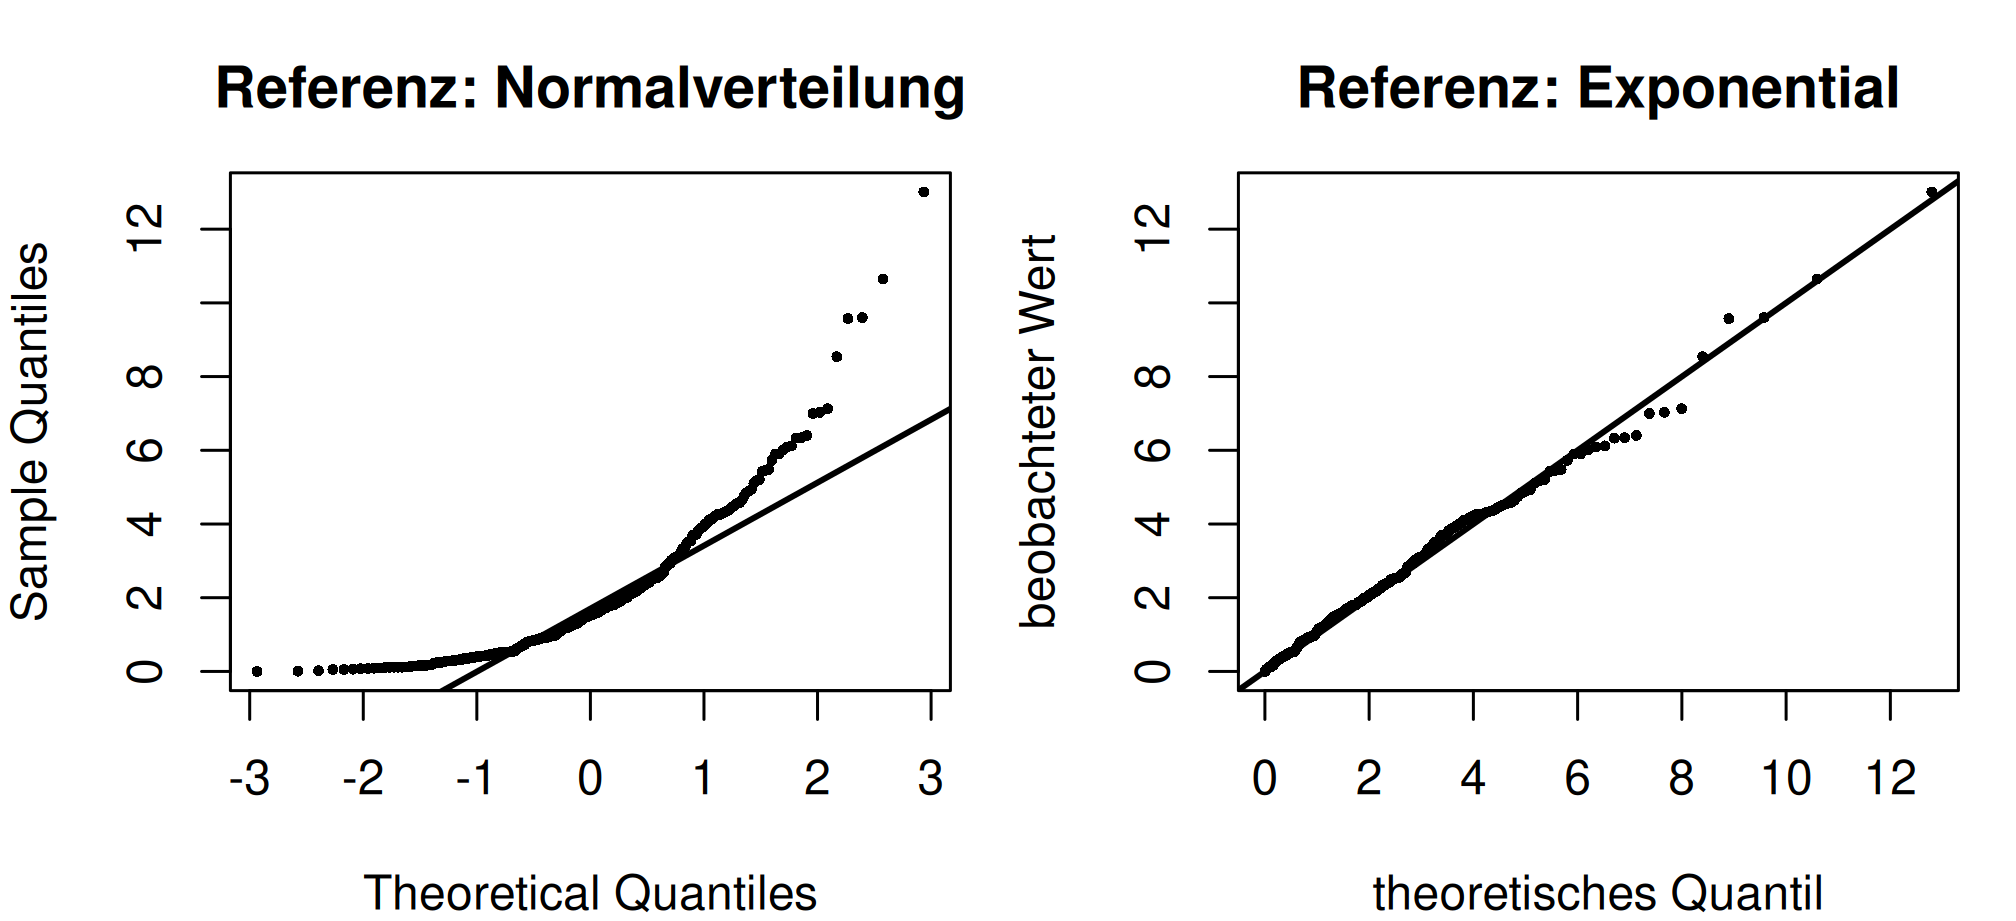
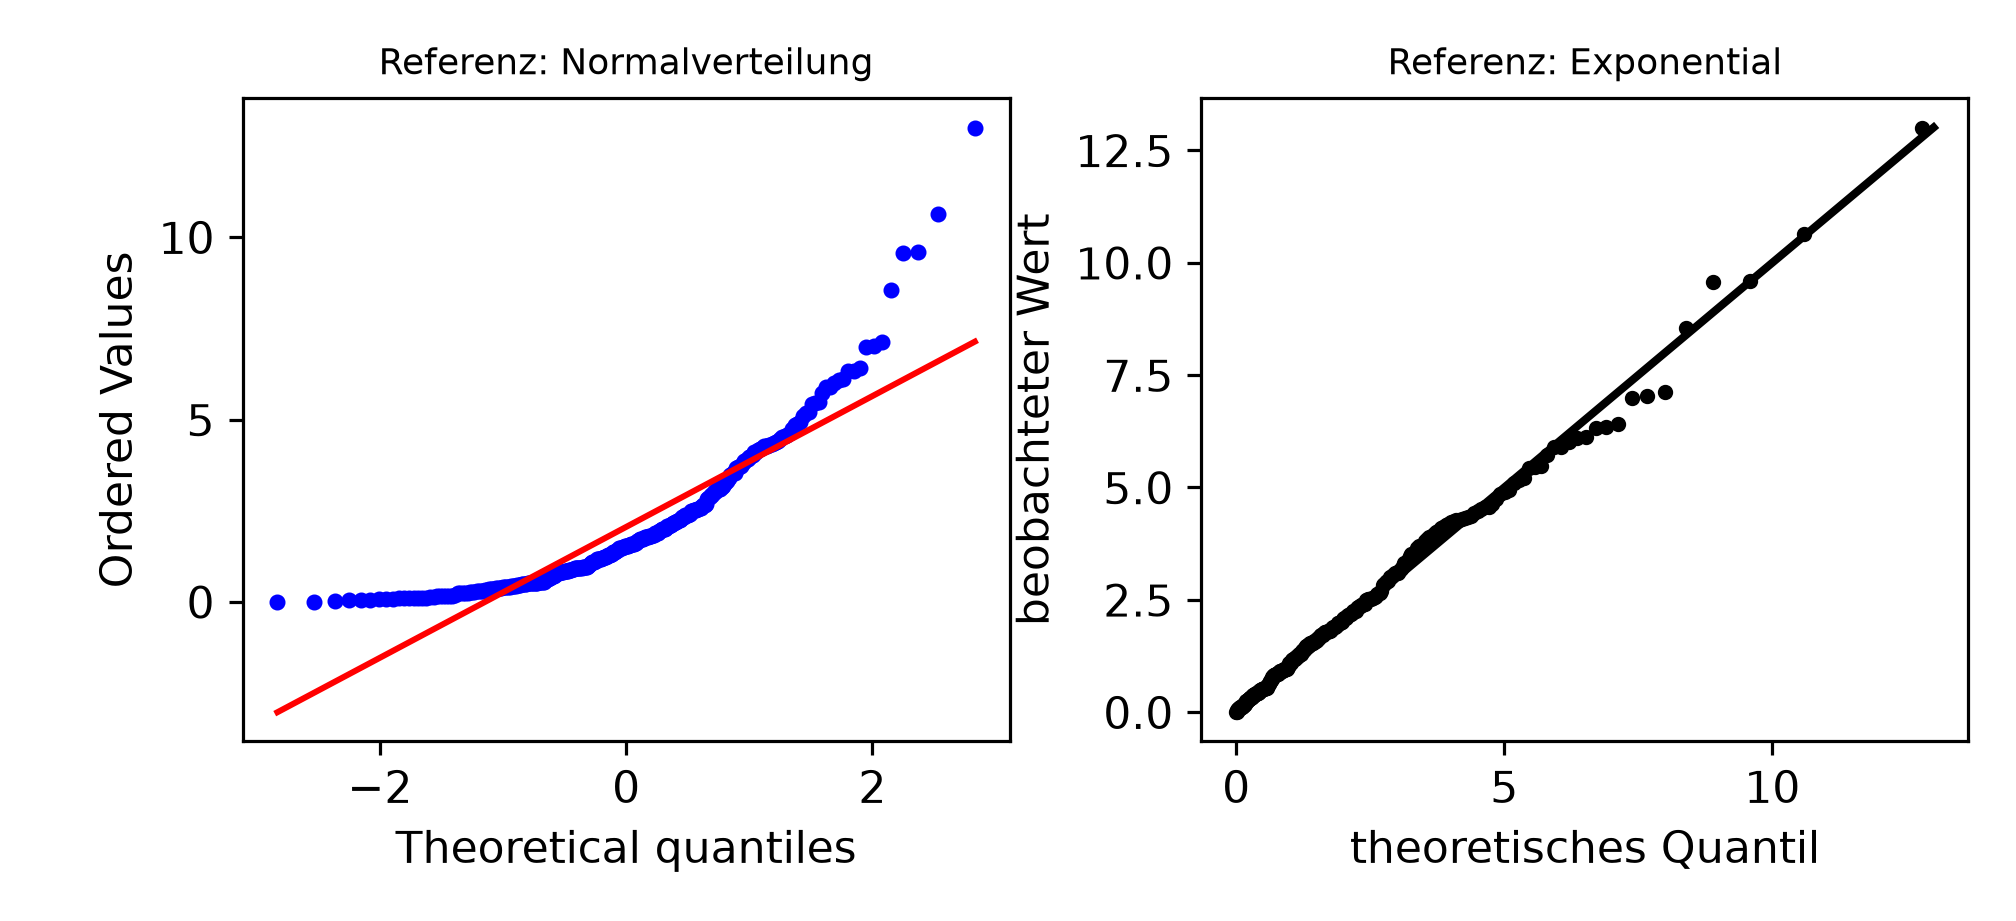
x <- round(qnorm(lehmer(1122, 10), mean = 20, sd = 4), 1)
sortiert <- sort(x)

n <- length(x)
position <- (seq_len(n) - 0.5) / n      # empirische Quantilstufen
theoretisch <- qnorm(position)          # theoretische Quantile

round(data.frame(rang = seq_len(n), wert = sortiert,
                 position = round(position, 4),
                 theoretisch = round(theoretisch, 4)), 4)
rang wert position theoretisch
1 1 10.5 0.05 -1.6449
2 2 16.2 0.15 -1.0364
3 3 20.9 0.25 -0.6745
4 4 21.1 0.35 -0.3853
5 5 21.8 0.45 -0.1257
6 6 21.9 0.55 0.1257
7 7 22.4 0.65 0.3853
8 8 22.9 0.75 0.6745
9 9 23.1 0.85 1.0364
10 10 23.2 0.95 1.6449par(mfrow = c(1, 2), mar = c(4, 4, 3, 1))
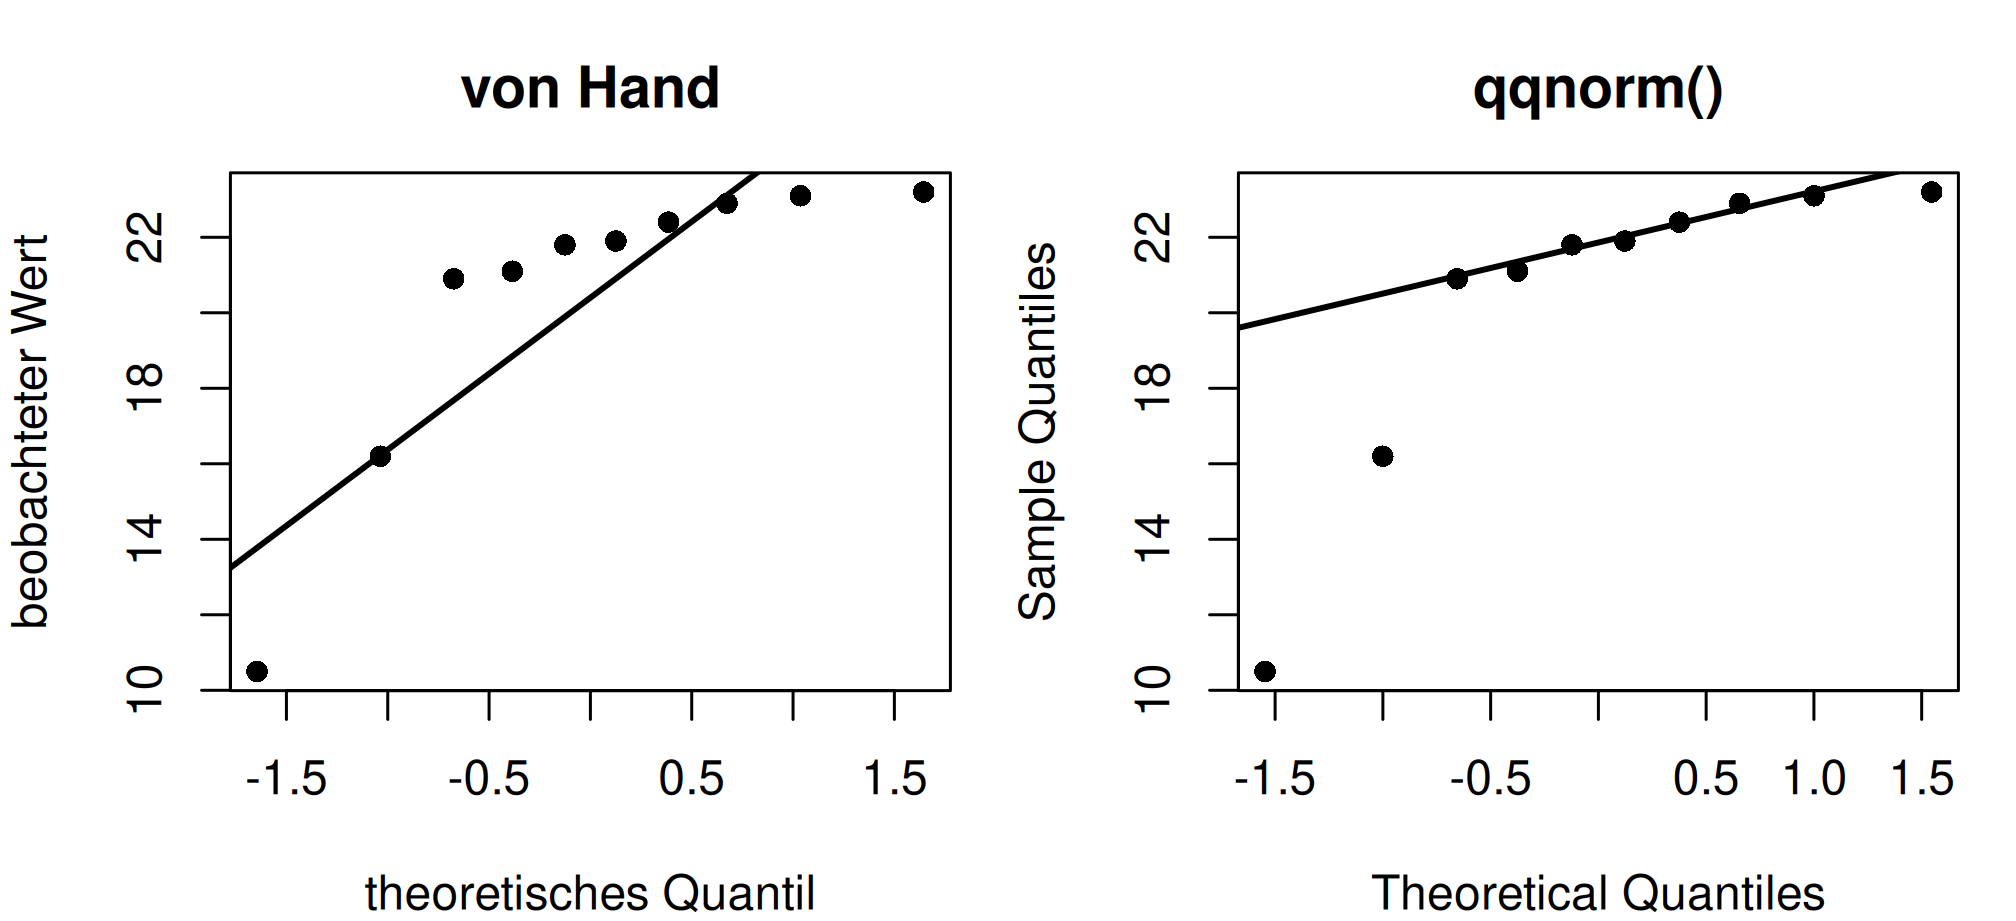
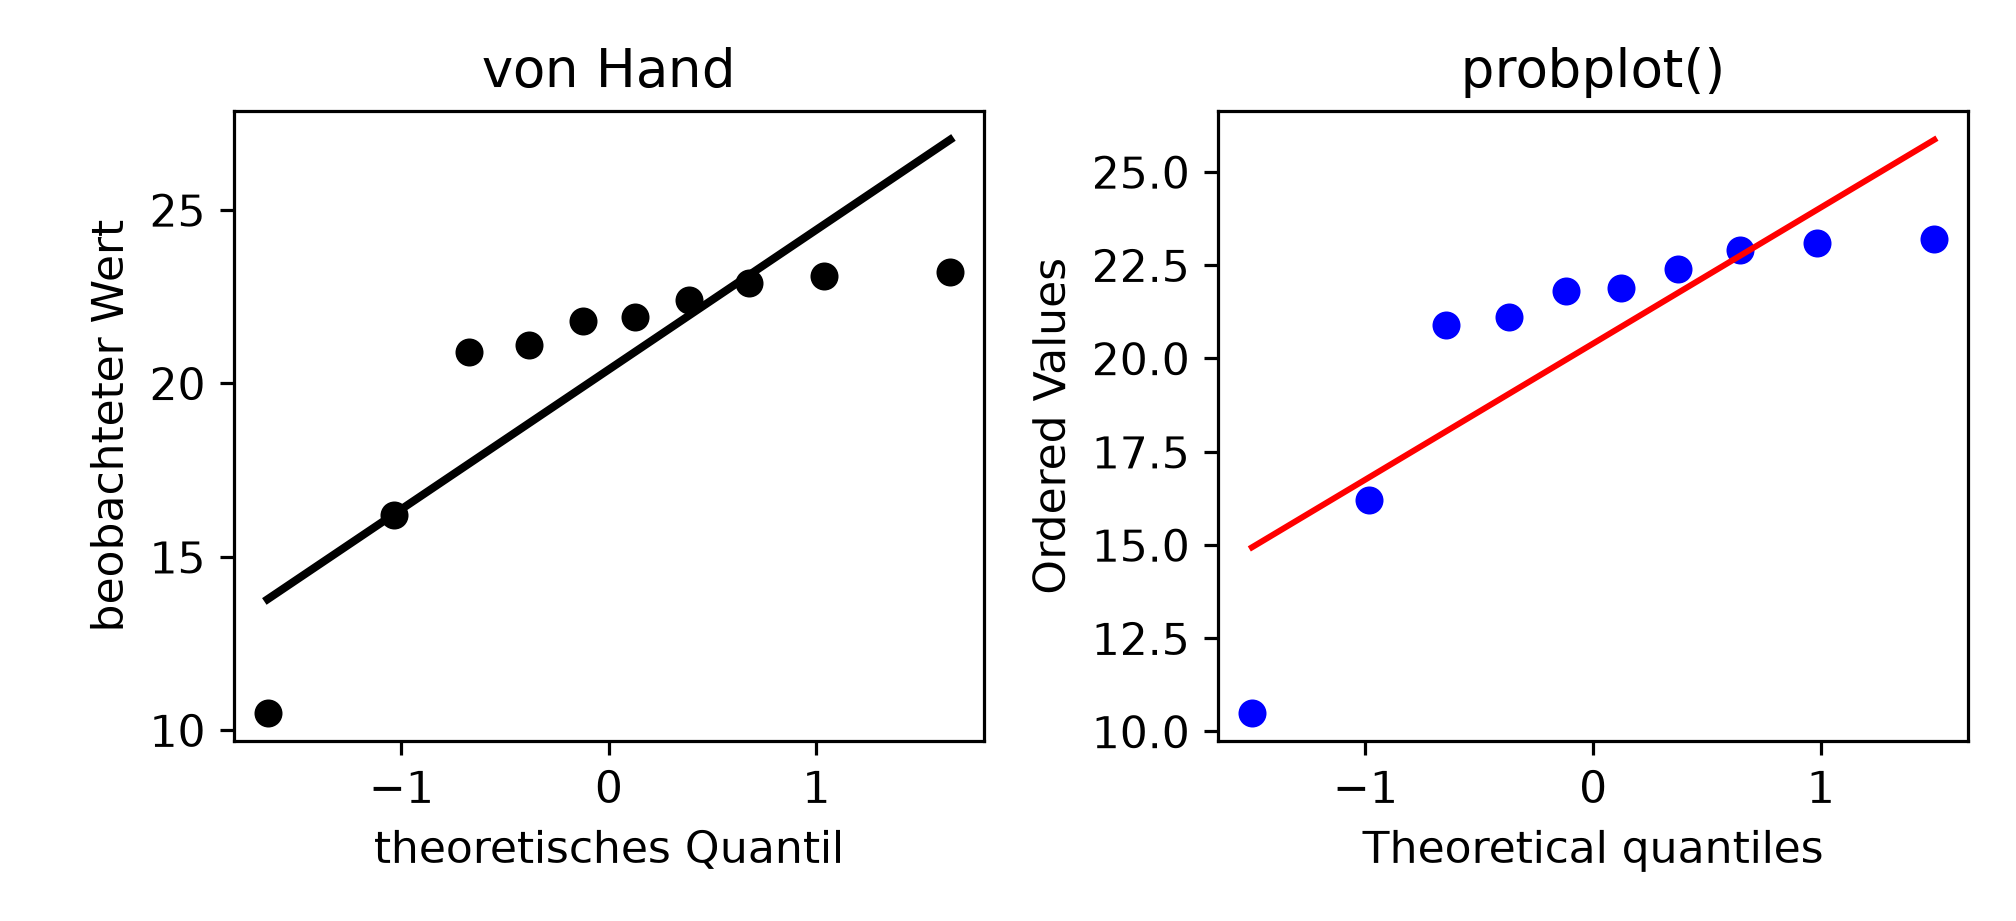
plot(theoretisch, sortiert, pch = 16, main = "von Hand",
xlab = "theoretisches Quantil", ylab = "beobachteter Wert")
abline(a = mean(x), b = sd(x), lwd = 2)
qqnorm(x, pch = 16, main = "qqnorm()")
qqline(x, lwd = 2)
par(mfrow = c(1, 1))
round(c(mittel = mean(x), sd = sd(x),
steigung_der_geraden = coef(lm(sortiert ~ theoretisch))[2]), 3) mittel sd
20.400 4.027
steigung_der_geraden.theoretisch
3.399